
1.0 Predicting Readmission Likelihood
While hindsight could be ostensibly useful, foresight is a fan favorite- Who doesn’t want to know what the future (or one of the possible many futures) looks like?
Now when foresight is put to refined use in the healthcare domain, specifically utilizing claims data and auxiliary features to predict the probability of a particular member being readmitted based on his previous claim record, then, we arrive at the prologue of our endeavor which is exactly that.
Probably the most important question is why are we predicting readmission probability? To answer that, here’s a brief overview of the MassHealth DSRIP program- The Massachusetts Delivery System Reform Incentive Payment (DSRIP) program is a $1.8 billion, five-year investment program authorized through MassHealth’s federal 1115 waiver. The DSRIP program funds three major initiatives central to transforming MassHealth: Accountable Care Organizations; Community Partners/Community Service Agencies; and Statewide Investments.
This initiative was taken by MassHealth after analyzing the Medicaid population which is purely borne by the state. They found that most of the costs were due to two seemingly large sections of the population categorized as BHCP, i.e., the behavioral health population and the LTSS, i.e., the Long-Term Social Service population (if one person uses a service billed to the state for more than 2 consecutive months in a 1-year period, then that member would come under LTSS). Both populations historically have been taken care of by ACOs but MassHealth initialized the DISRP protocol in hopes of reduces such costs to the state. This is where CPs (Community Partners) come into the picture.
CPs do not intervene clinically, but they provide community outreach and intervention programs in an attempt to reduce the total final billed cost to the state via ACOs where the members get their services. CPs basically act as a liaison between ACOs and Medicaid members to try and reduces the cost by ameliorate non-clinical factors that might deteriorate members’ health and lifestyles and ultimately increase the state’s expenditure on healthcare.
The project was envisioned to help a particular CP determine the members at a higher risk of readmission and use that information instantly to either follow up or surgically decrease the chances of readmission via non-clinical intervention, thereby eliminating any unnecessary cost of readmission.
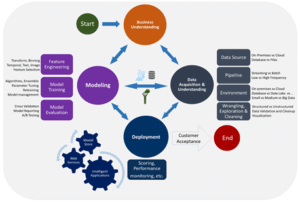
2.0 Technical Approach (Process Methodology for the Data science project)’
- robust back office Finance Team, HR Team and quality assurance staff.
2.1 Exploratory Data Analysis
The claims data used in building the prediction model was predominantly BH population and the model is tuned to fit the current and similar BH/LTSS cohorts.
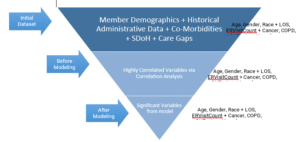
We started off with Member Demographics, Historical Administrative Data, Co-Morbidities, Social Determinants of Health (SDoH), HEDIS Care Gaps.
It has been observed that previous research only includes one type or a combination of a few types of data listed above. However, our approach encompasses all such data with acceptable veracity for this PoC, which makes this project a unique endeavor.
These different kinds of data and features had to be analyzed for any correlation with the outcome, i.e., readmission of that member.
Once the highly correlated variables were filtered out and selected, via clinical knowledge and statistical significance, the next phase, namely, data wrangling starts.
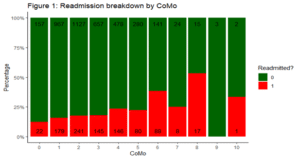
One example that shows the importance of EDA is that when we look at the following chart of readmission percentage by number of co-morbidities, we can safely assume that members with a higher number of comorbidities have a higher readmission percentage, which leads us to believe that co-morbidity data could be valuable for prediction.
2.2 Data Flow
The data is imported from a SQL server database into R, which now has to be analyzed structurally, cleaned, imputed and transformed into data that can act as input to the machine learning model.
The missing data values are imputed according to statistically proven methods to minimize the error introduced into the model.
The data is centered and scaled to eliminate clinically controversial results that could pop up due to unnormalized data.
2.3 Data Model
The question about the future in itself has a BINARY answer, thus, making this a binary classification problem.
Logistic Regression is the gold standard of binary classification problems as it gives us the log likelihood of an outcome. Furthermore, the odds ratios that can be extracted from the coefficients can answer clinically crucial questions through easily understandable numbers.
The initial log model as simply to find associations between the features and outcome and to observe whether it made any clinical sense.
It did.
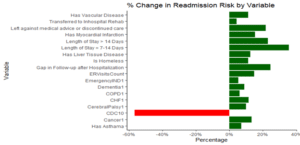
So, we went ahead with a Lasso Regularization on the initial log model to eliminate any and every feature that might cause overfitting, thereby, accounting for the Bias-Variance tradeoff.
These were the odds ratios converted to percentages to observer their effects on the outcome.
3.0 Predicting Readmissions
3.1 Data
The model was built on claims data with a lot of historical information on the patient.
However, the goal is to predict the probability of readmission of a member as soon as they are discharged.
To accomplish that, we use patient pings, which give us instant information (once discharged) about the member’s current LOS, whether they went to the ER and discharge status.
Now, aggregating the current information with the historical information gives us enough data which is already structured to fit the model. Therefore, we can now use the model to make a ping level prediction aggregated by member.
3.2 Visualizing the Readmission Probability
Although, it was a numbers game until this point. The data, model and predictions should be able to provide actionable insights to the community partner, so that they can utilize the analysis effectively for their patient population respectively.
Therefore, an automated PowerBI report that updates every week with the new patients pings and their likelihood of readmission has been created for easy access by the CP.
This is a quick look at the report that includes filters by date, ACOs, active population and member details which is interactive.
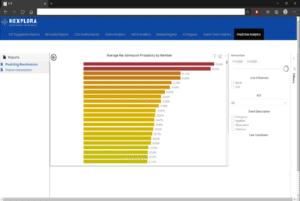
Please note that sensitive information has been hidden according to HIPAA regulations
The predictions at the member level are a 30-day rolling average depending on the number of pings.
The various functions involved in the Hexplora project management methodology are explained below
3.3 Enhancements and Discussions
The prediction model used is a lasso regularized logistic regression which is considered to be highly interpretable with acceptable performance. However, advanced machine learning models could lead to higher AUC albeit with less interpretability.
The prevalence rate of readmission for the current cohort is around 16%. This makes the probability of a person getting readmitted quite low, which is why SMOTE is being currently testing to synthetically oversample the minority class in hopes of making the final probabilities much more realistic and transferable across intervening medical professionals and/or healthcare workers. This might come at the cost of accuracy, which makes this a business decision.
We want to reiterate the fact that this model has been trained and tuned to fit a predominantly BH cohort with less that 25% LTSS population. Furthermore, it acts as a PoC until the accuracy of the validation set (Patient Pings) can be verified aptly. Finally, the veracity of the data has to be certified to an acceptable extent before this can be called a generalized readmission predictor model.
